






Key Takeaways
• Analyst Michaël van de Poppe says Bitcoin has swept the lows on higher timeframes and is more likely to break upward than downward.
• BTC traded around $81,600–$82,200 on Sunday, with $80,000 the level most analysts cite as key support.
• Bitcoin dipped to $79,694 earlier in the week before buyers stepped in.
• A move above $82,000–$83,000 could open a path toward $90,000, according to the bullish view.
• Not everyone agrees: one chartbook warns of a drop toward $67,000–$71,000 if $80,000 fails.
He also acknowledged that Monday could bring some “doom” on the markets, though he suggested that if that is what everyone expects, it probably won’t play out. The remark fits the mood in traditional markets. U.S. stock ETFs closed lower Friday, with the Nasdaq 100 proxy down about 2.5%, according to a MarketAlleys daily brief. Whether that is what he had in mind is an inference, not something he said.
His chart, posted with the message, shows Bitcoin hovering just above a support line near $80,178 after trading around $82,111. That is the price he marked when the chart was created on October 18.
What “Sweeping the Lows” Means
A sweep happens when price briefly dips below an earlier low, triggering stop-loss orders, and then recovers. Traders often read a quick rebound after a sweep as a sign that sellers are exhausted.
That is roughly what happened here. CoinDCX data showed Bitcoin’s drop to $79,694 undercut earlier lows at $80,308 and $80,948 before buyers absorbed the selling. Order-book data cited by Currency Analytics also showed bids stacking near $80,000.
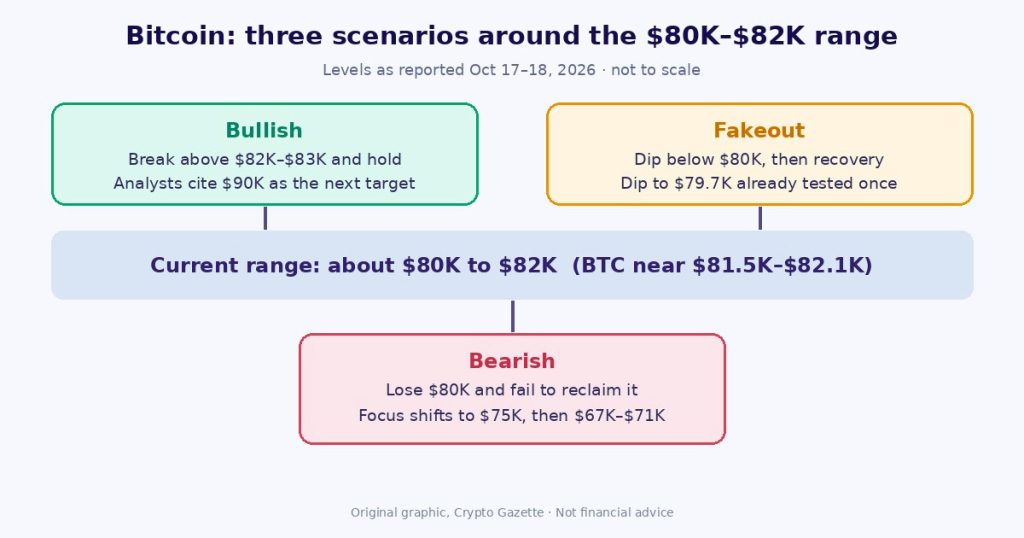
Several analysts are looking at the same zone. According to Huoxing Finance, Van de Poppe has said Bitcoin’s range is narrowing and volatility is falling, which often comes before a large move. He noted that a fakeout could first push BTC below $80,000, and that a break above $82,000 could accelerate toward $90,000.
Other technical readings are less bullish. Currency Analytics noted that Bitcoin has been printing lower highs since peaking at $87,374, and that it trades below its 20-period moving average near $83,400. Support sits at the 50-period averages near $80,400–$81,300. Weekly RSI, on the other hand, was above neutral at 56.75, according to Crypto.news.
Other Signals: Valuation and Positioning
Onchain analyst Darkfost said Bitcoin’s MVRV fell to 25.7%, below the 30th percentile. He noted that Bitcoin has historically spent only about a quarter of its time in that range, a zone some traders treat as accumulation. It is a historical pattern, not a guarantee.
Positioning looks stretched on the other side. CoinLab reported that Bitcoin perpetual funding on Binance ran above the prior month’s average, suggesting traders were paying a premium to hold leveraged longs. The same report gave a 55% chance of a $80,600–$82,900 weekend range, and it pointed to ETF outflows as a sign of weak institutional demand.
Why It Matters for Bitcoin and Altcoins
Bitcoin’s range matters for the rest of the market because altcoins usually follow its direction. A clean breakout would likely lift sentiment across majors, while a break below $80,000 could trigger more liquidations. Ethereum was near $2,411 and down about 4.5% over five sessions, according to MarketAlleys.
Bitcoin was about 2.6% lower over five sessions, based on the same brief. So the market is still consolidating rather than trending.
Risks to the Bullish Case
The bullish view has plenty of opponents. Popeye’s Chartbook says Bitcoin remains in a corrective structure and a break below $80,000 would shift focus to the daily 200-day average near $72,000, then potentially $67,000–$71,000. The same note says a confirmed break above wedge resistance, with $83,000 held as support, would strengthen the upside case.
Thin weekend liquidity can also exaggerate moves, and a weak open for U.S. stocks could drag crypto lower. Any hot economic data or hawkish Fed comment would add to the pressure. This is analysis, not a forecast, and no single indicator is decisive.