






Ethereum is approaching a decision point for traders who believe its latest weakness could precede a recovery. A technical-analysis chart circulating as a trading thesis presents a familiar pattern: price consolidates, slips below its range, and potentially reverses into an upward move.
The idea is straightforward. If ETH falls below a level where many traders have placed stop-loss orders, the resulting selling could be followed by a recovery if buyers step in.
But there is a catch. A drop below support can precede a rebound, or it can signal that the market is preparing to move lower. The chart alone cannot tell us which outcome will occur.
That distinction matters as Ethereum’s recent price performance shows continued short-term pressure. Historical data from Investing.com put ETH’s October 26 price at around $2,313, compared with approximately $2,389 on October 22, although prices vary by exchange and reporting time.
For traders leaning bullish, the question is no longer simply whether Ethereum has fallen enough. It is whether the market can produce evidence of a genuine reversal.
What the Ethereum chart is trying to show
The supplied chart divides price action into three stages: accumulation, manipulation and distribution.
These labels come from a style of technical analysis that attempts to interpret how price moves around areas where traders may have concentrated their orders.
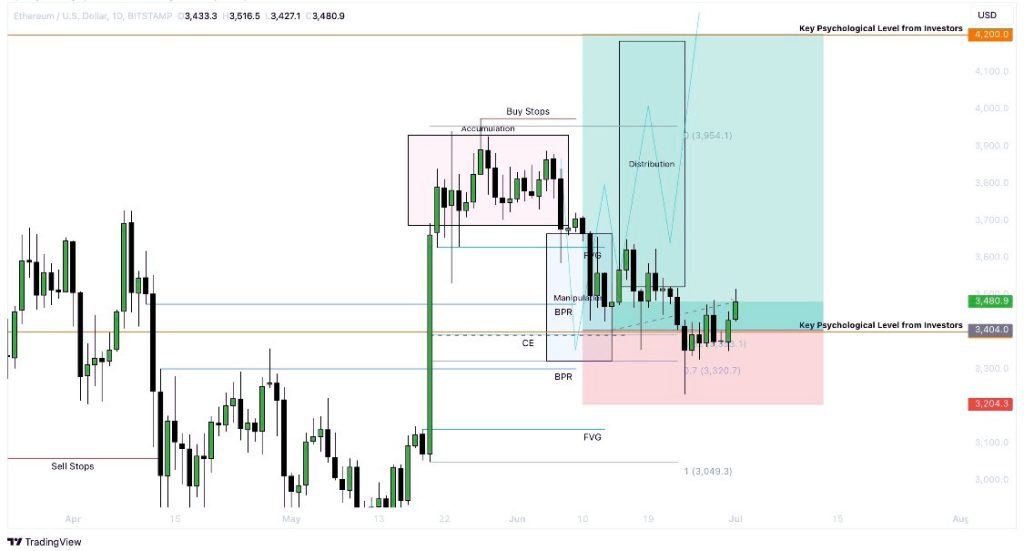
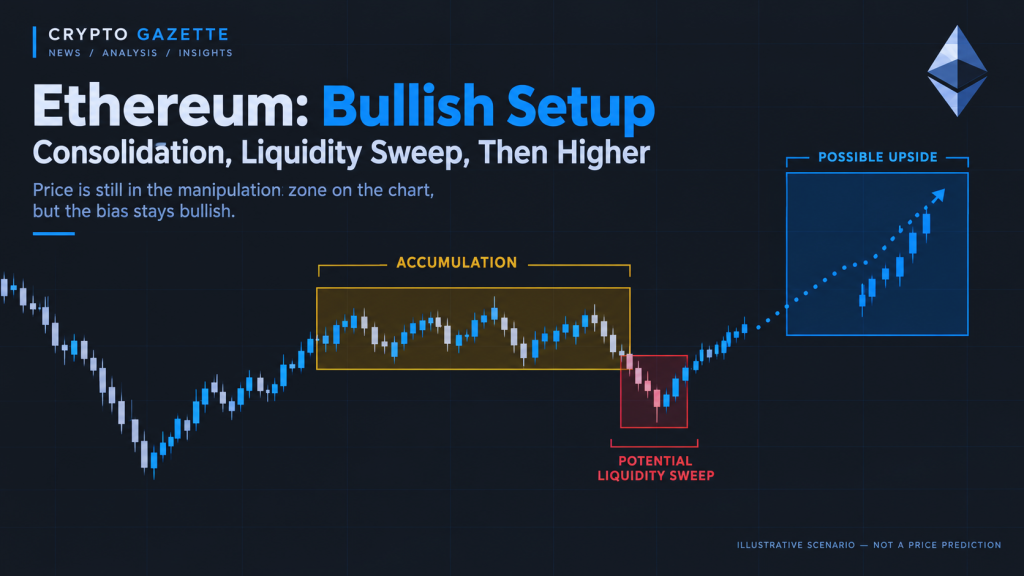
The first stage, accumulation, is a period in which price trades within a relatively narrow range. Buyers and sellers continue trading, but neither side produces a sustained breakout.
The second stage is the potential liquidity sweep. Price moves below the range, potentially triggering stop-loss orders from traders who had positioned themselves for a continued recovery.
The final stage is the anticipated upward expansion. If buyers absorb the selling and price returns above the former range, traders may interpret that recovery as evidence that the breakdown has failed.
The chart uses a blue area to illustrate the expected upward move.
However, it does not provide a verified ETH price target, a defined entry point or a timeframe. Its upward projection should therefore be read as a possible scenario rather than a forecast supported by independently verified market data.
Why a liquidity sweep can matter
A liquidity sweep is a price move through a level where orders are believed to be concentrated.
Consider a simplified example.
ETH trades between $2,400 and $2,450. Some traders buy near the lower boundary, placing stop-loss orders just below $2,400. Others sell short if the price breaks below that level.
If ETH briefly falls to $2,380 before quickly recovering above $2,400, the move could trigger stop-loss orders and force some leveraged positions to close.
That burst of selling may provide liquidity for buyers entering the market. Traders using this framework then watch to see whether the price recovery continues.
The key signal is not the initial drop. It is what happens afterward.
If ETH reclaims the broken level and holds above it, the failed breakdown may support a bullish interpretation. If price remains below the range or continues making lower lows, the argument for a bullish reversal becomes weaker.
These figures are hypothetical examples, not current Ethereum support or resistance levels.
Does a liquidity sweep prove market manipulation?
No.
The word manipulation can be misleading because it suggests deliberate wrongdoing. In some trading communities, however, it is used more loosely to describe a move that clears liquidity around a previous high or low.
Those are different claims.
A price decline may result from ordinary selling, changing market sentiment, liquidations, thin order books or large orders moving through the market. Establishing actual manipulation would require evidence beyond a candlestick pattern.
The U.S. Commodity Futures Trading Commission warns that virtual-currency markets can expose traders to volatility, fraud and manipulation risks. That warning establishes that these risks exist; it does not establish that a particular ETH move has been manipulated.
For readers, the practical lesson is simple: evaluate the price action without assuming that every sharp move has been engineered to trap traders.
Ethereum’s recent weakness complicates the bullish argument
The broader market context is important because a bullish pattern can fail when the underlying trend remains weak.
Investing.com’s historical data shows ETH moving from approximately $2,389 on October 22 to around $2,313 on October 26. Although the precise figures vary among providers, the overall direction during that period was lower.
That does not rule out a recovery. Markets can reverse after sustained selling, and short-term weakness can sometimes create conditions for a rebound.
But a decline is not automatically evidence of accumulation. Nor does a move below support necessarily mean that sellers have exhausted themselves.
To strengthen the bullish case, traders would want to see evidence such as:
- A failed breakdown: ETH moves below a clearly identified support level but quickly recovers.
- A reclaim of support: Price returns above the broken level and holds there.
- A change in market structure: ETH begins forming higher lows and breaks a relevant previous high.
- Improved participation: Trading volume and other market data support the recovery rather than showing another weak bounce.